


INVESTING • READ TIME: 6 MIN
"The first rule of investment is 'buy low and sell high,' but many people fear to buy low because of the fear of the stock dropping even lower.
Then you may ask: 'When is the time to buy low?' The answer is: When there is maximum pessimism."
Sir John Templeton
What is the VIX?
As Bob Dylan sang in “Subterranean Homesick Blues,” “you don’t need a weatherman to know which way the wind blows” - but, sometimes, it’s helpful to have a gauge to measure the force of that wind.
Generally, most investors have a sense of when markets are volatile. The Chicago Board Options Exchange (CBOE) Volatility Index, colloquially known as “the VIX,” measures the anticipated volatility in the US stock market and can be used to characterize investor sentiment - it’s the “weatherman” to the market’s winds.
A Closer Look at the Volatility Index
The VIX, as an index, is not a tradable security. It is simply a measure of expected volatility in the US stock market based on options prices of the S&P 500 Index. There are, however, numerous financial products (ETFs, for example) that track the index and allow for portfolio exposure to the CBOE Volatility Index.
By combining the weighted prices of near-term call and put options (used for hedging or speculative purposes) on the S&P 500, the intent of the VIX is to measure anticipated volatility and investor sentiment. Essentially, by weighting and analyzing call and put options on the S&P 500, the VIX measures the speed at which the markets are expected to change over the next thirty days.
As a measure of sentiment, the VIX is also sometimes referred to as the fear gauge.
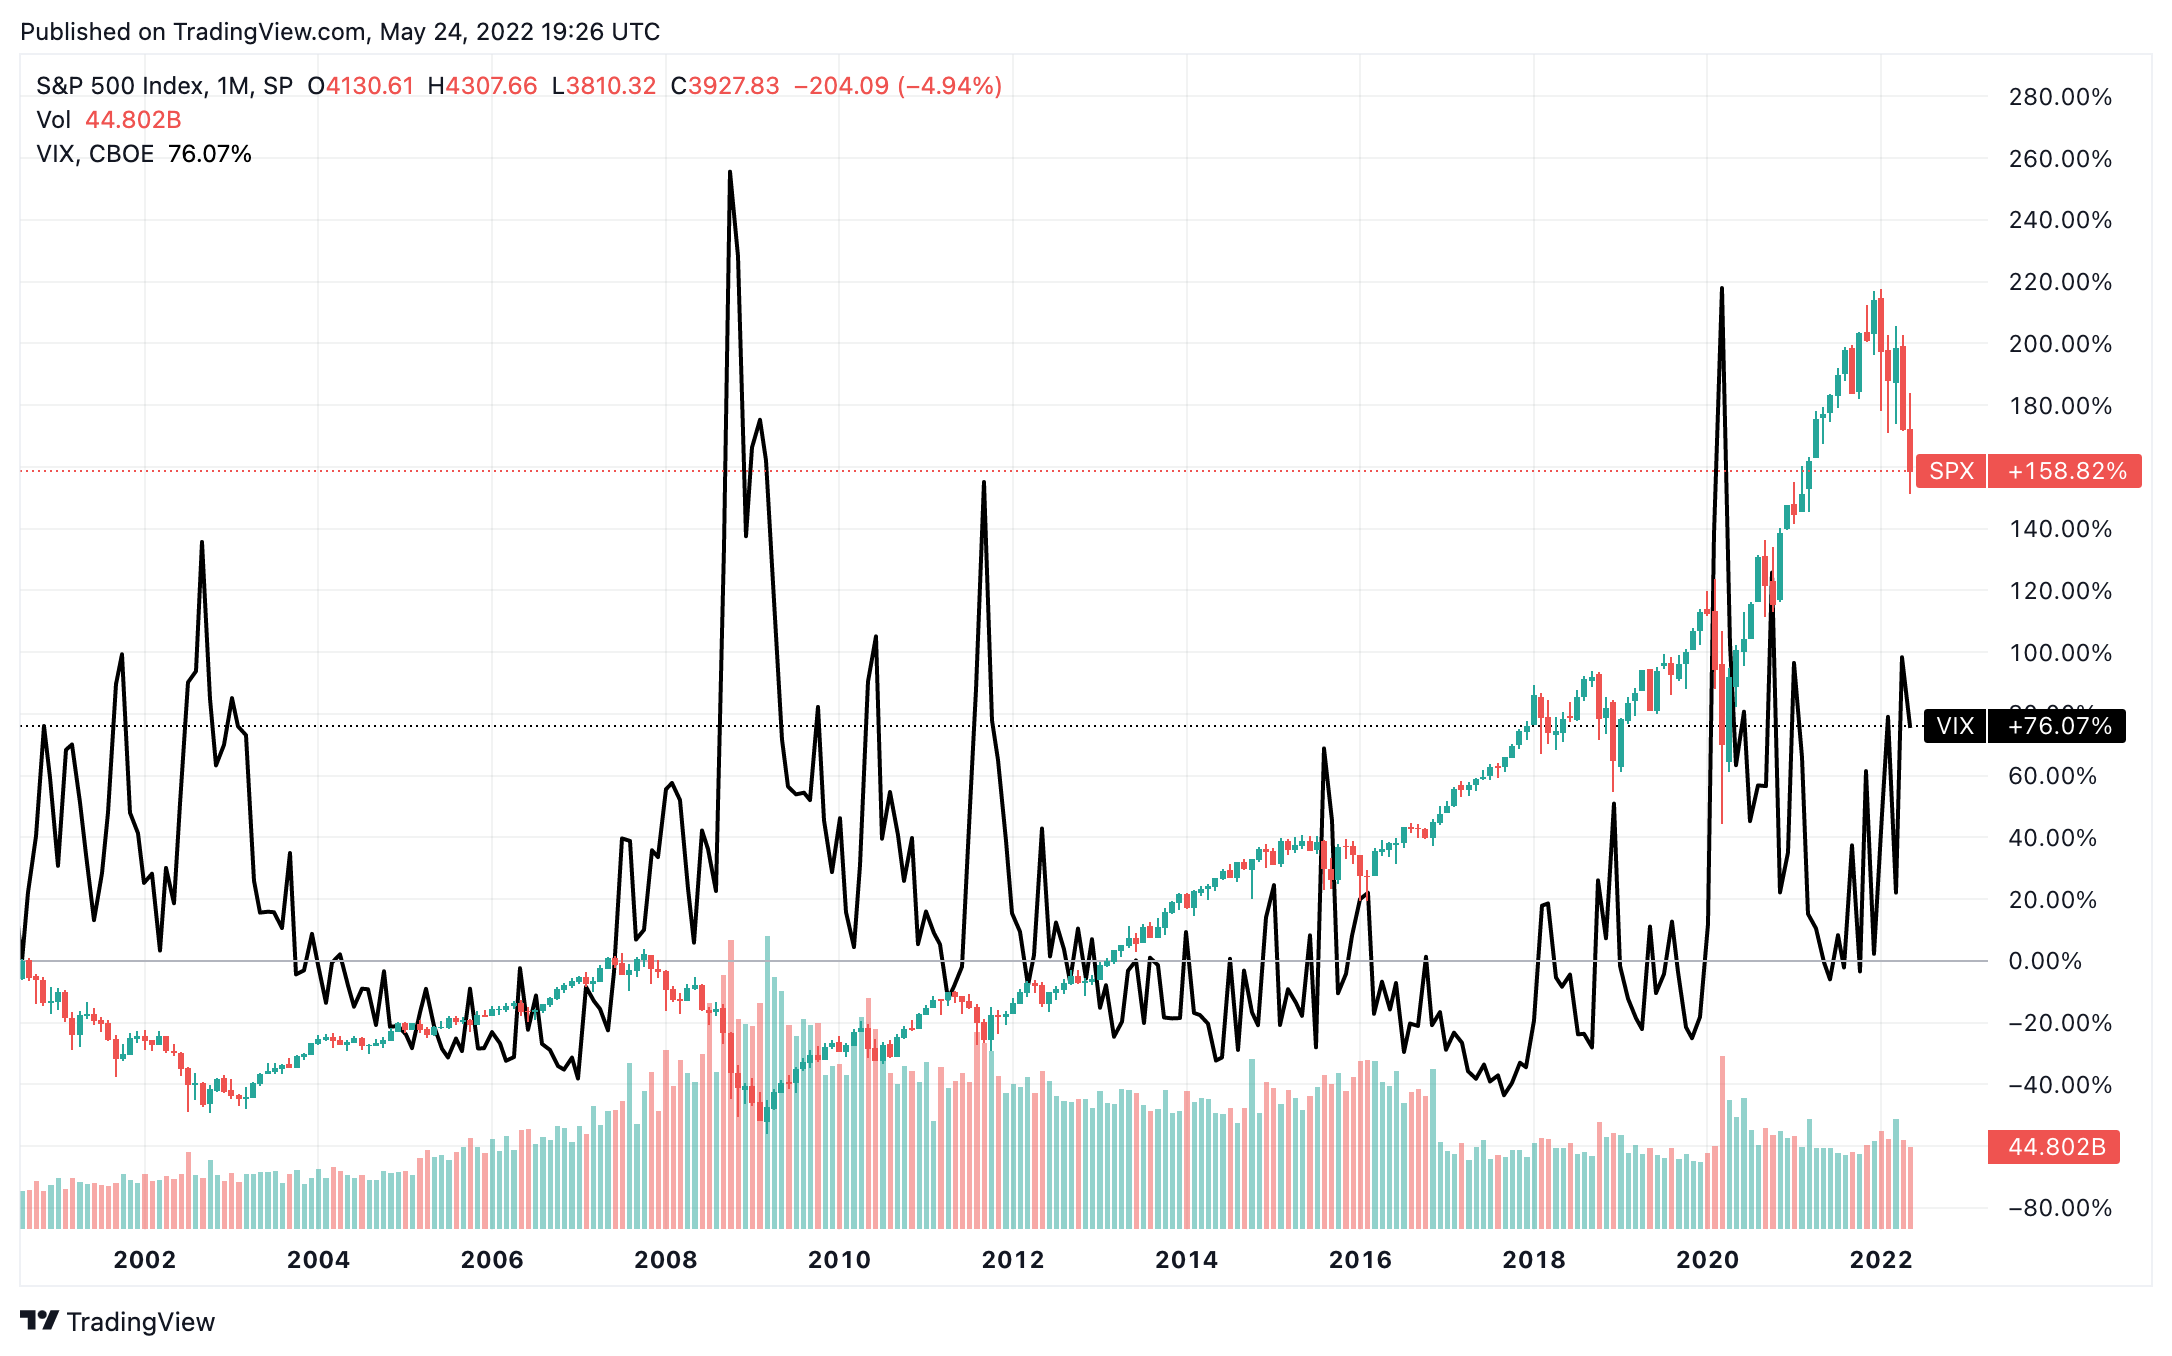
In short, the VIX provides a quantifiable measure of anticipated risk within the stock market, and of investor sentiment, by assessing the price action of S&P 500 index derivatives. This relationship is clarified in the image below - the black line represents the VIX and the red and green candles illustrate the S&P 500 (the bar chart below is trading volume.) Significant spikes in the VIX - in 2009 and 2020, for example - indicate severe price declines and points of maximum "fear."
VIX Measurements and Limitations
Because the CBOE Volatility Index uses near-term options to gauge market risk and investor sentiment, it’s a predictive gauge. Meaning, the present (actual) volatility is not specifically included. Call and put options, on any index or other security, are primarily used as a form of hedging - or, in simpler terms, they are used as a form of insurance. These options provide buyers with the right, but not the obligation, to buy (call options) or sell (put options) the underlying security at a given price (the strike.)
The premium changes on these options - decreasing or increasing - indicate the general sentiment toward the underlying security. Rising premium costs indicate an anticipation of future volatility (volatility increases when prices move up or down.) As such, increasing put or call premiums on the S&P 500 indicate heightened risk or uncertainty. As a measure of US stock market volatility, then, the VIX is designed to rise and fall with the premiums on these options.
Making Sense of the Index
Although there are limitations - the VIX is predictive (not descriptive), the VIX measures short-term expectations, general sentiment will vary based on a number of factors, etc. - some general rules hold true.
Namely, a spike (upward) in the Volatility Index indicates an increasing belief among options traders and other investors that market volatility will increase. As the Volatility Index increases, the higher the level of “fear” (remember, it’s also called the fear gauge…informally) in the market. Conversely, a decrease in the index indicates relative calm.
Historically, when the VIX reaches 30 or greater this is considered to be significantly heightened fear and/or uncertainty. Unsurprisingly, the VIX exceeded 60 during the March 2020 “COVID crash.” Values below 20 typically indicate stable, less volatile markets.
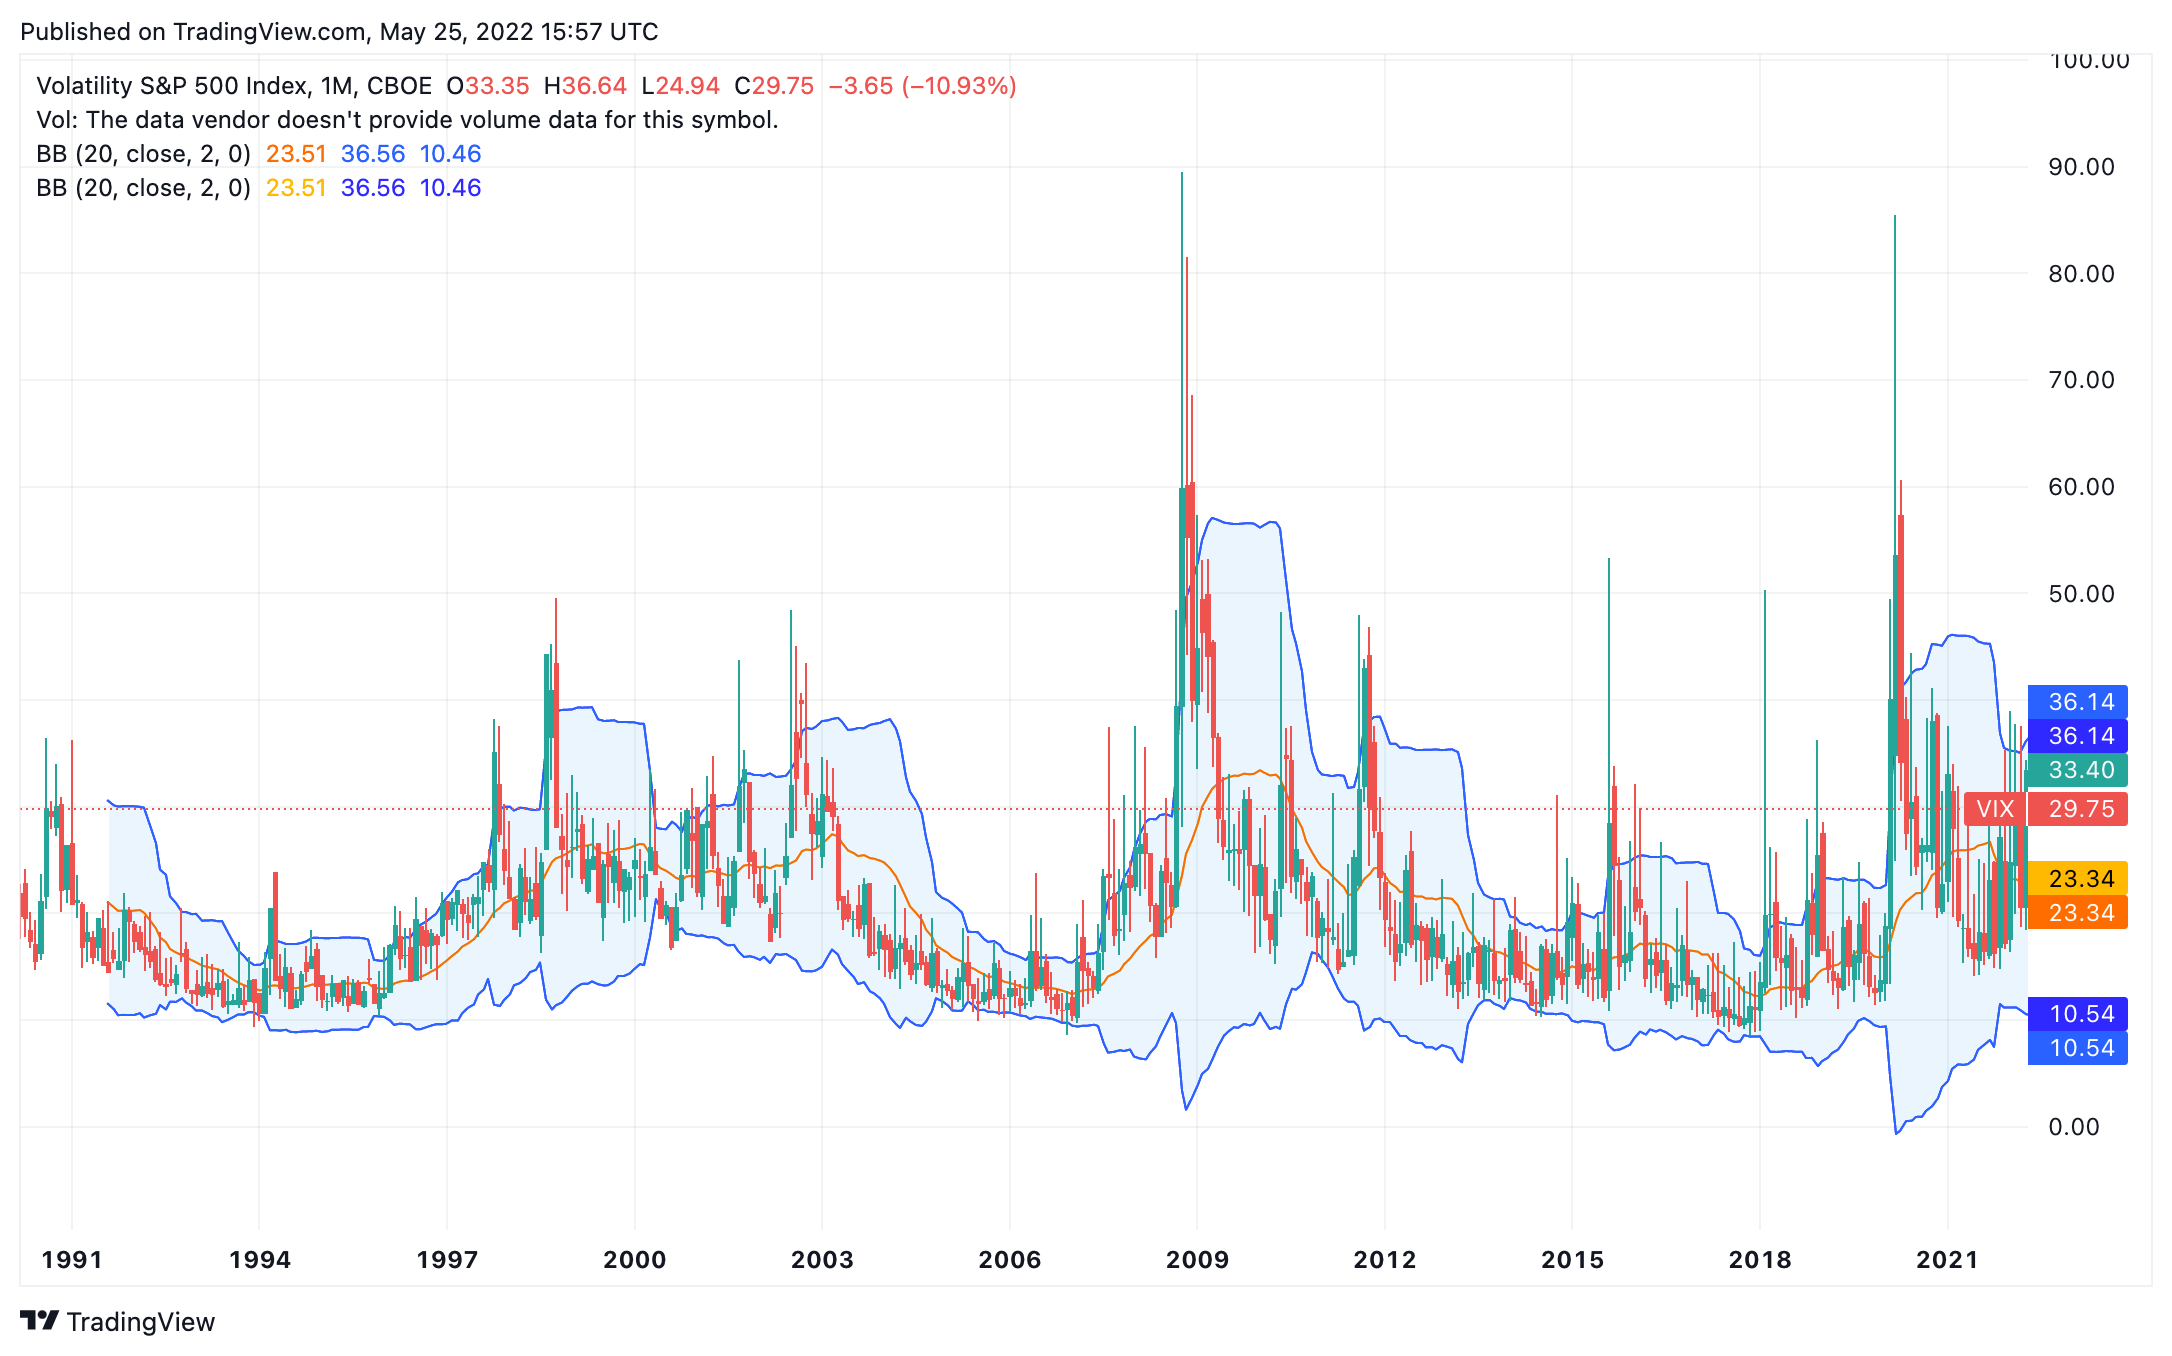
Finally, it is important to note that volatility, in general, is mean-reverting. Essentially, it is historically unlikely for volatility to remain in elevated or depressed states for extended periods of time. The chart below depicts illustrates reversion to the mean - the blue bands outlining the VIX represent a two standard deviation move based on the 20-day moving average. In short, anything between the outer blue lines represents price movements within two standard deviations. Statistically, for any given security, approximately 95.4% of outcomes in a distribution of occurrences will fall within two standard deviations.
Putting (Current) Volatility in Perspective
Investing in the stock and/or bond market can be an emotional process. However, referencing and understanding the VIX may provide some (comforting?) historical perspective to market volatility. Remember, more often that not, markets are “up” despite day-to-day or other short-term swings - since 1926 (when the S&P Index began with 90 companies), the total return on the S&P 500 has been negative only 25 times.
For most investors, volatility is unpleasant, but it is an inherent part of investing. If you are seeking to minimize portfolio volatility or are concerned about its impacts on your portfolio (particularly around or at retirement), our team is available to discuss your questions and concerns. Set up a call or meeting with RP Wealth Advisors to learn how we can help.
The content is developed from sources believed to be providing accurate information. All investing involves risk, including the possible loss of principal, and there is no guarantee that any investment strategy referenced here will be successful. The information in this material is not intended as tax or legal advice. It may not be used for the purpose of avoiding any federal tax penalties. Please consult legal or tax professionals for specific information regarding your individual situation. This material was developed and produced by RP Wealth Advisors to provide information on a topic that may be of interest. The opinions expressed and material provided are for general information, and should not be considered a solicitation for the purchase or sale of any security.